Action Engine Logo
Enterprise Analytics Platform

AnalyticsReal-Time Insights. Instant Clarity.

Transform reactive troubleshooting into proactive optimization with enterprise-grade insights into automation performance. Get complete visibility and control over your automation ecosystem with real-time intelligence.

Command Center

Automation Analytics Dashboard – At a Glance

The Automation Analytics Dashboard brings all your automation insights into one clear, centralized view. It's designed to give you a complete picture of what's happening behind the scenes by combining live execution monitoring, historical trends, error insights, health scores, system-wide stats, and recent activity.
Action Engine Analytics - The Full Story Execution Details Modal in Salesforce Interface

Live Execution Monitoring

View automations in real time as they trigger and complete

Historical Trends

Analyze performance data over time, from 24 hours up to 90 days

Error Insights

Quickly see the most frequent or impactful issues across automations

Health Scores

Get a snapshot of each automation's stability and performance

System-wide Stats

Understand throughput, success rates, and overall usage at a glance

Recent Activity

Stay current with the latest runs, failures, and system changes

Your Automation Command Center: Everything that matters, all in one place

Instead of digging through logs or piecing together performance manually, this dashboard simplifies your view—helping you spot patterns, pinpoint issues, and track the impact of your automations across the org. Ideal for ops teams, admins, or execs looking for real-time clarity, historical context, and system-wide visibility—without switching between tools or screens.

Complete Analytics Suite

Every aspect of your automation performance, from real-time monitoring to predictive insights
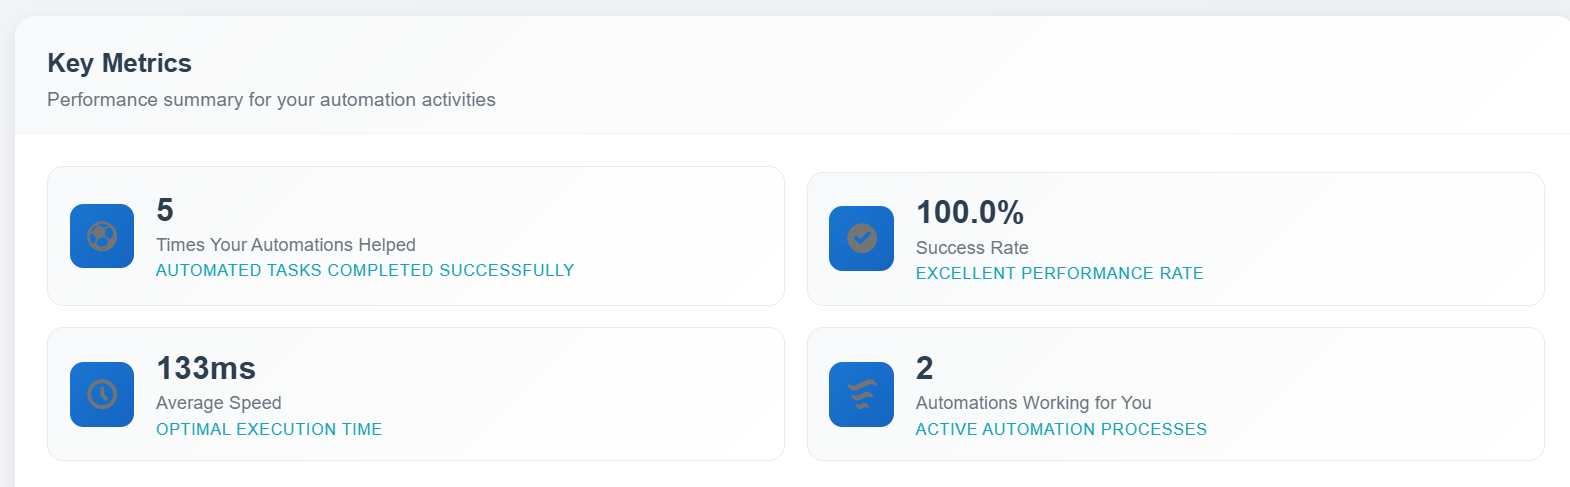
Key Metrics

Big-picture numbers that matter
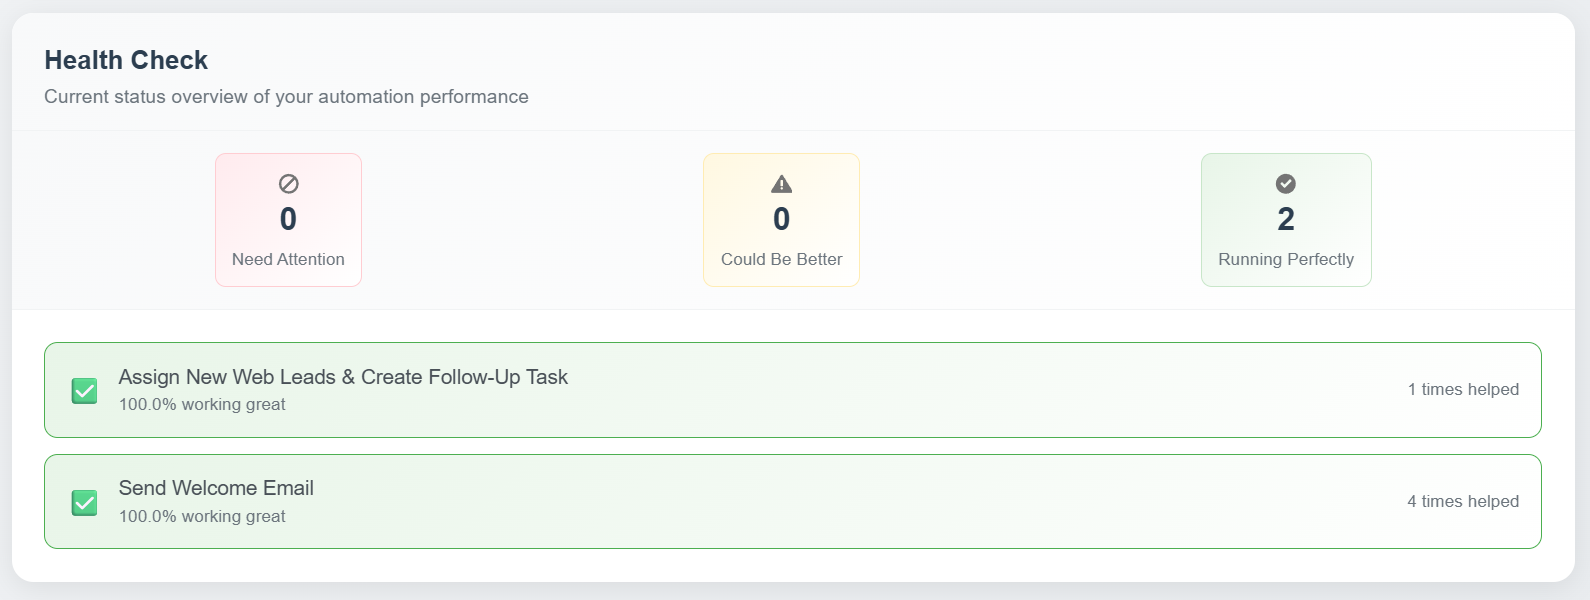
Total automations run, success rates, how many are active, and how much time your automations are saving. Great for showing the business impact to your team or leadership.
Action Engine Key Metrics - Executive Dashboard
Total executions volume
Success rate percentage
Active automations count
Time saved metrics

Health Check

Issues before they become problems
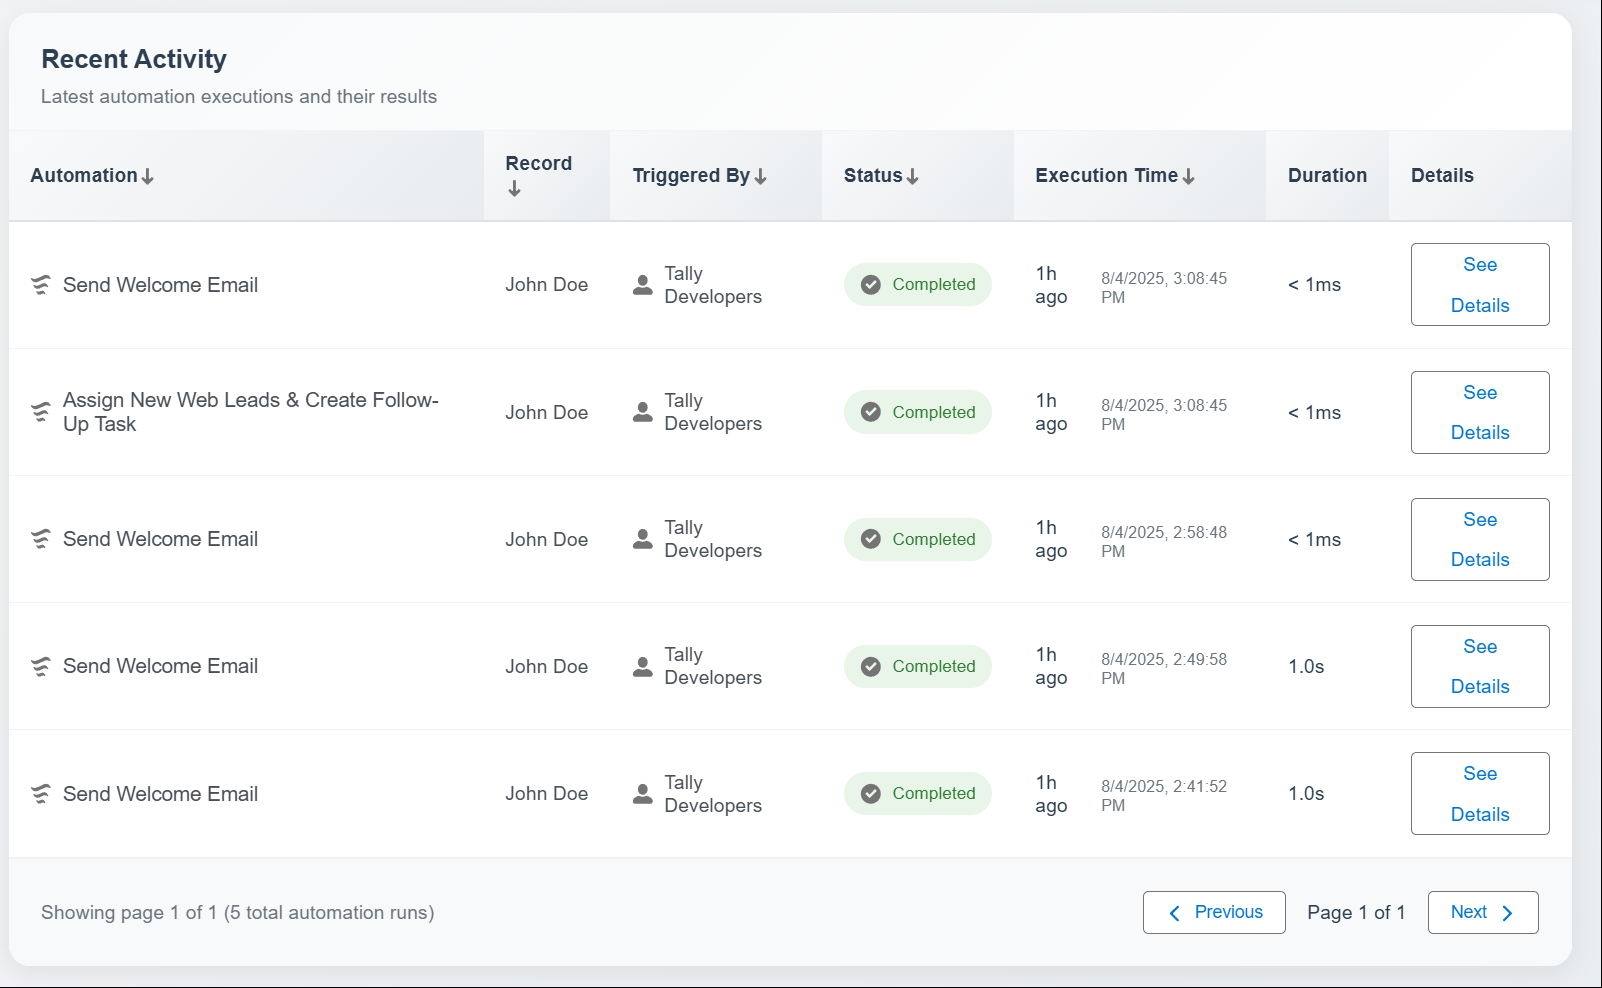
This checks your automations behind the scenes and warns you if something's about to break—like a missing field or a broken reference—so you can fix it before users even notice.
Action Engine Health Check - Proactive Monitoring
Individual automation scorecards
Predictive failure detection
Configuration validation
Broken reference detection

Recent Activity

What's happening right now
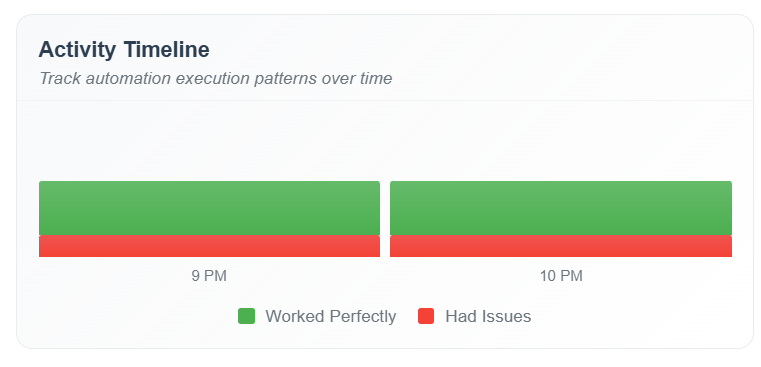
A live feed of automation activity—when something runs, fails, completes, or gets updated—so you're always in the loop, in real time.
Action Engine Recent Activity - Real-time Execution Feed
Live execution stream
Real-time failure alerts
Completion notifications

Activity Timeline

When your automations are running, and how often
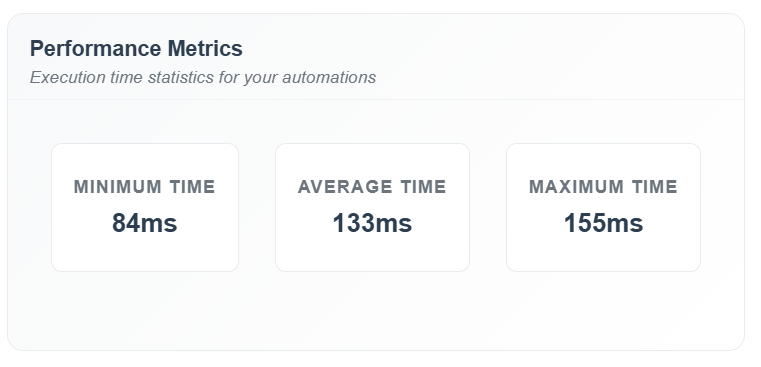
This gives you a clear, visual timeline of your automation activity—hour by hour or day by day. You'll see when things are busiest, how many are succeeding or failing, and whether your usage is growing over time.
Action Engine Activity Timeline - Execution Patterns
Hour by hour activity
Usage growth trends

Performance Metrics

How fast and efficient your automations are
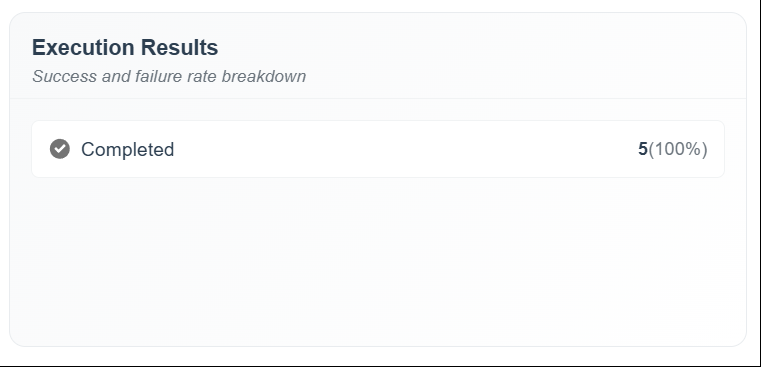
See how long automations take to run, how many records they're processing, and where things might be slowing down—so you can spot and fix bottlenecks.
Action Engine Performance Metrics - Efficiency Analysis
Execution duration tracking
Bottleneck identification

Execution Results

What happened each time an automation ran
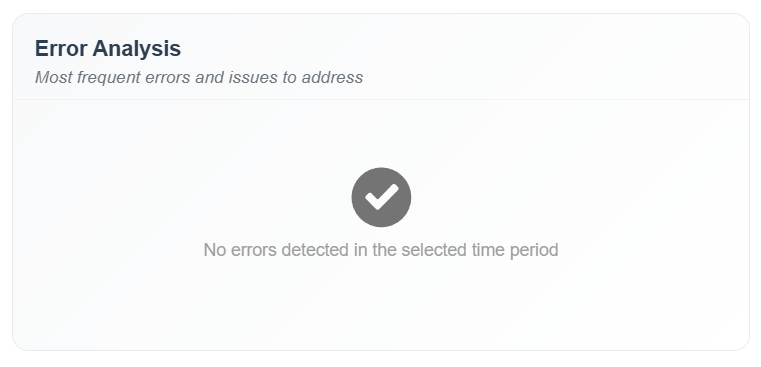
Every automation run is logged here. You can see exactly when it ran, how long it took, what it did, and which steps passed or failed—like a detailed receipt for each automation.
Action Engine Execution Results - Success Rate Breakdown
Detailed execution logs
Step-by-step breakdown

Error Analysis

Why automations fail (and how often)

No more digging through logs. This breaks down the top 10 reasons automations fail—like missing field access or validation errors—so you can fix problems faster and track if your system is getting more stable.
Action Engine Error Analysis - Failure Intelligence
Top 10 failure reasons
System stability tracking

Enterprise-Ready Features

Built for scale, security, and reliability in enterprise environments

Governor Limit Optimized

Built specifically for Salesforce's enterprise constraints and limitations

Security Compliant

Follows AppExchange security standards with enterprise-grade data protection

High-Volume Ready

Designed for organizations with thousands of automations and high execution volumes

Error Categorization

Automatically classify different types of failures with action-level insights

Historical Data Retention

Long-term trend analysis and reporting with comprehensive data retention

Operational Intelligence

Transform reactive troubleshooting into proactive optimization strategies

Ready to Transform Your Automation Management?

This isn't just basic logging - it's a comprehensive business intelligence platform specifically designed for automation workflows, providing the insights needed to optimize, scale, and maintain reliable automation at enterprise scale.